この射出成形における溶着ガイドでは、材料選定、設計レビュー、製造、および調達に関する実務上の考慮事項について解説します。.
溶接線とは何ですか?
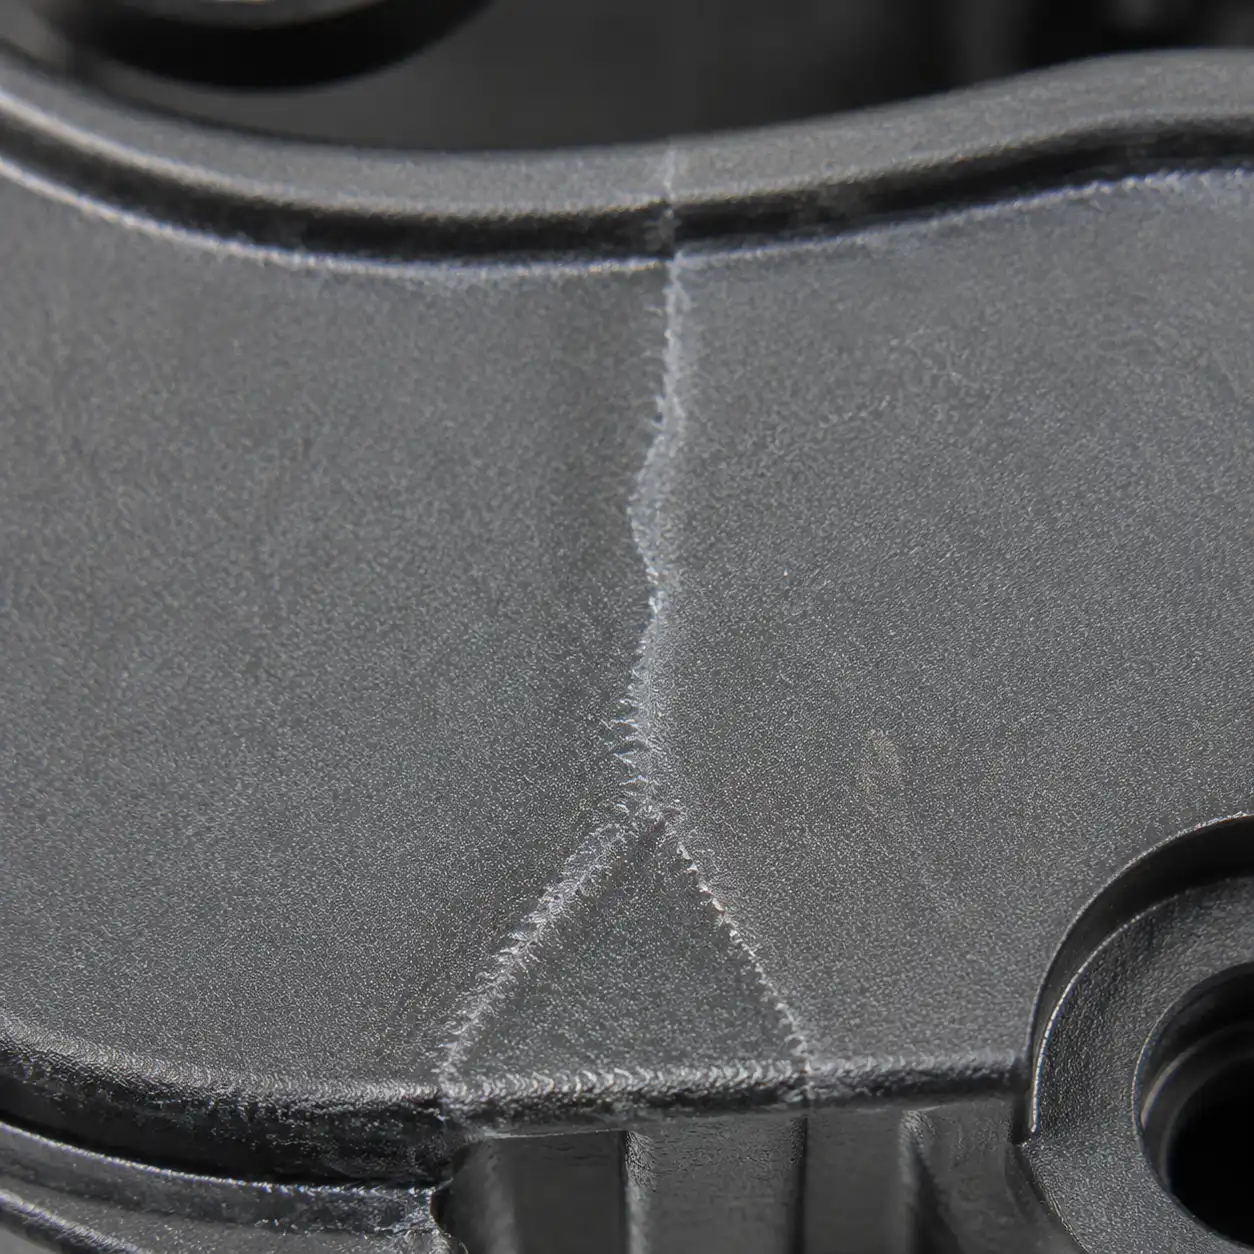
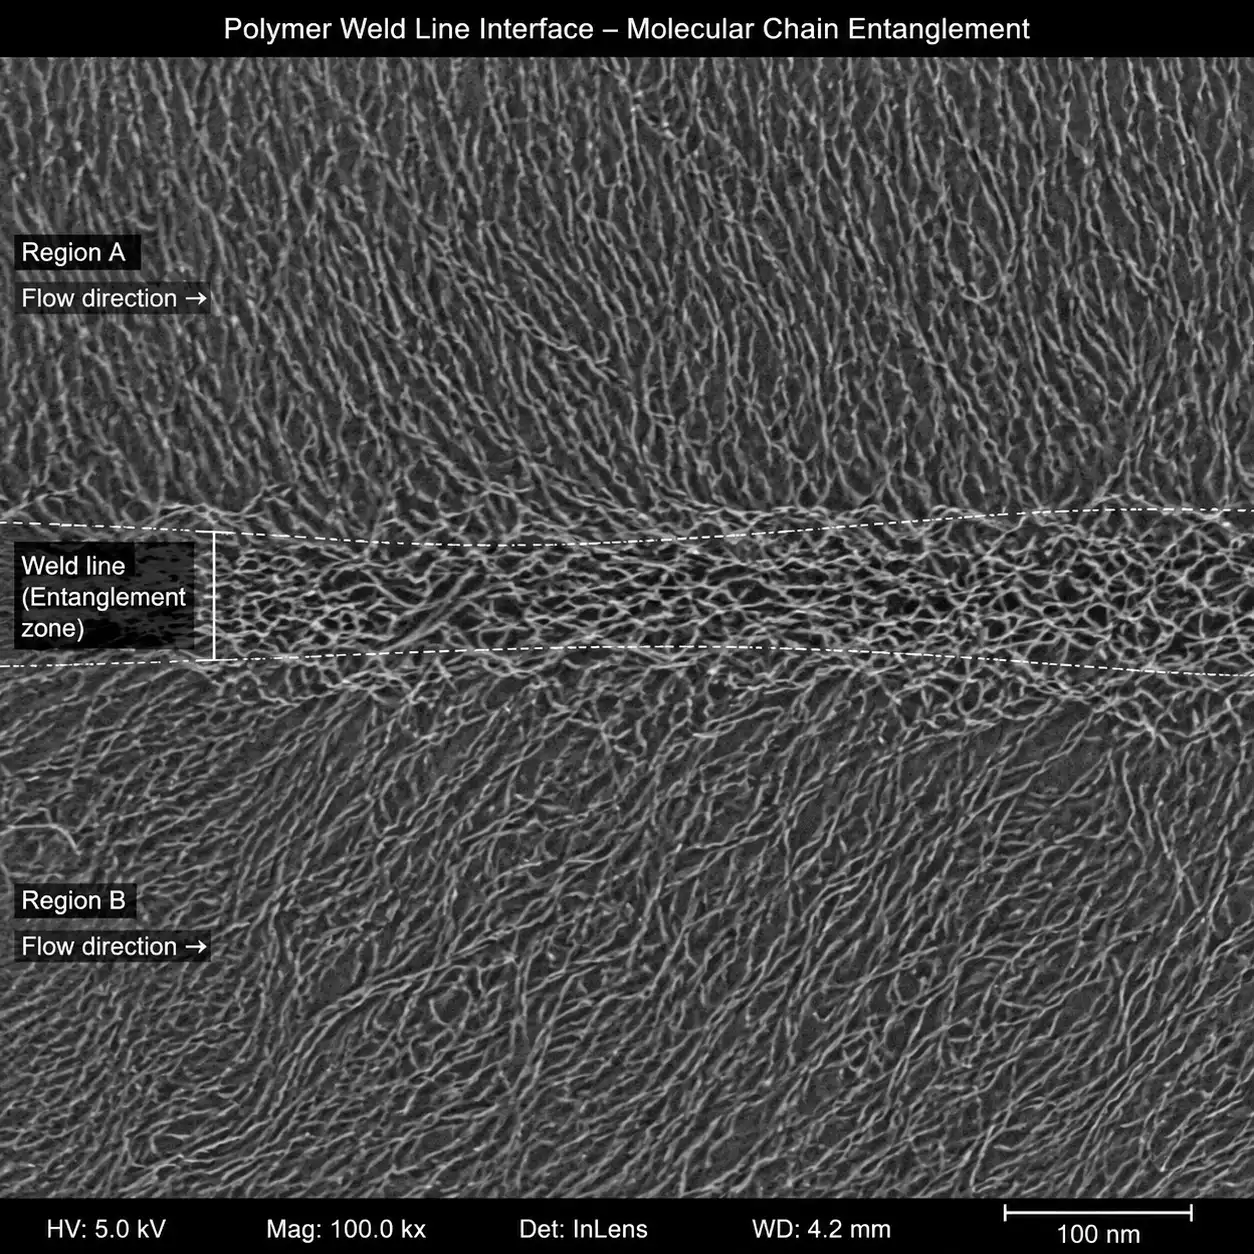
溶接線(ニットラインとも呼ばれる)とは、射出成形工程において、2つ以上の溶融ポリマーの流れ面が接触した際、分子レベルで完全に混ざり合わなかったために生じる線状の欠陥である。その結果、部品表面に目に見える線や機械的強度が低下した領域が生じ、さらに重大な問題として、肉厚全体にわたってその影響が及ぶことになる。.
溶接線は、機械的には次のように定義される。 ポリマー鎖の絡み合いが不完全な領域. 流れの波面が合流する際、前進する波面にある高分子分子はすでに冷却が始まっており、流れの方向に平行に配向し始めている。合流面では、反対側からの鎖は互いに浸透し合うのではなく、単に接合するだけであるため、引張荷重や衝撃荷重がかかると、微小亀裂のように振る舞う境界が形成される。.
射出成形の欠陥の中でも、ウェルドラインは特に危険です。これは、表面上の目視検査では見過ごされがちである一方で、局所的な機械的強度が20-70%低下してしまうためであり、その結果、これらは #1の隠れた構造上の欠陥 成形部品において。.
溶接線はなぜ生じるのか?
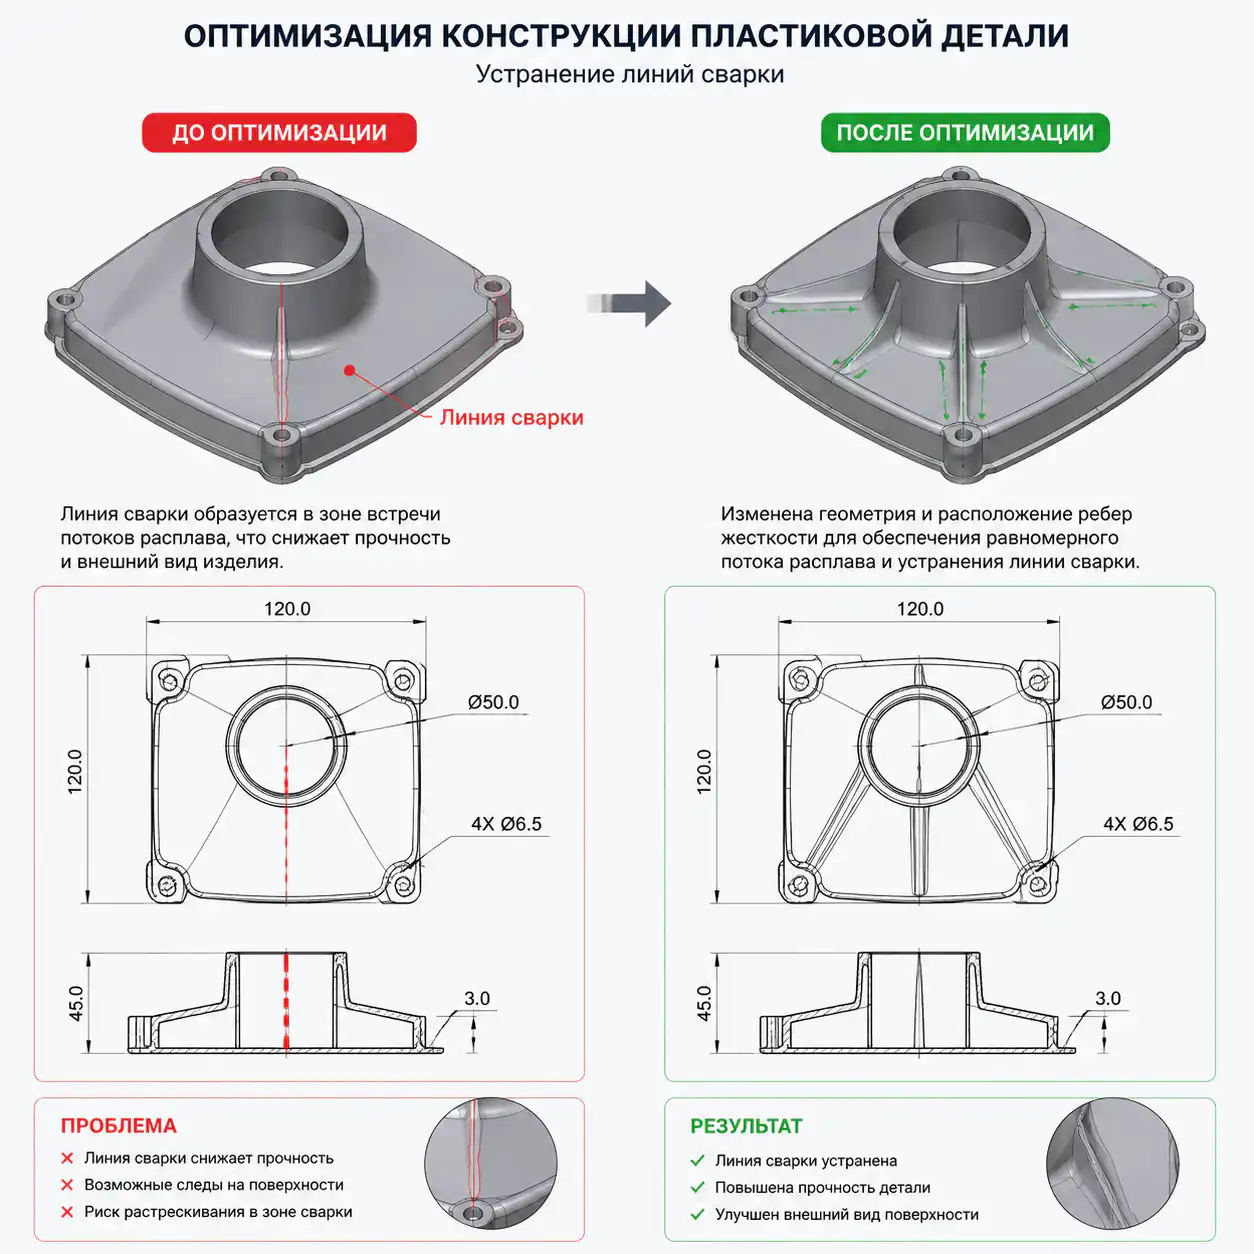
ウェルドラインはランダムに生じるものではありません。キャビティの充填中に流れが分岐し、再び合流する箇所に形成されます。ウェルドラインの発生の90%以上は、主に以下の3つのケースに起因しています:
1. 障害物(穴またはインサート)を通過した後の流れの境界面
溶融ポリマーが金型内のコアピン、インサート、あるいはその他の障害物に遭遇すると、溶融流は2つの流れに分かれ、障害物を迂回して下流側で再び合流します。これは最も一般的なウェルドラインの発生メカニズムであり、穴やスリット、金属インサートがあるほぼすべての部品に見られます。.
2. マルチゲート・コンバージェンス
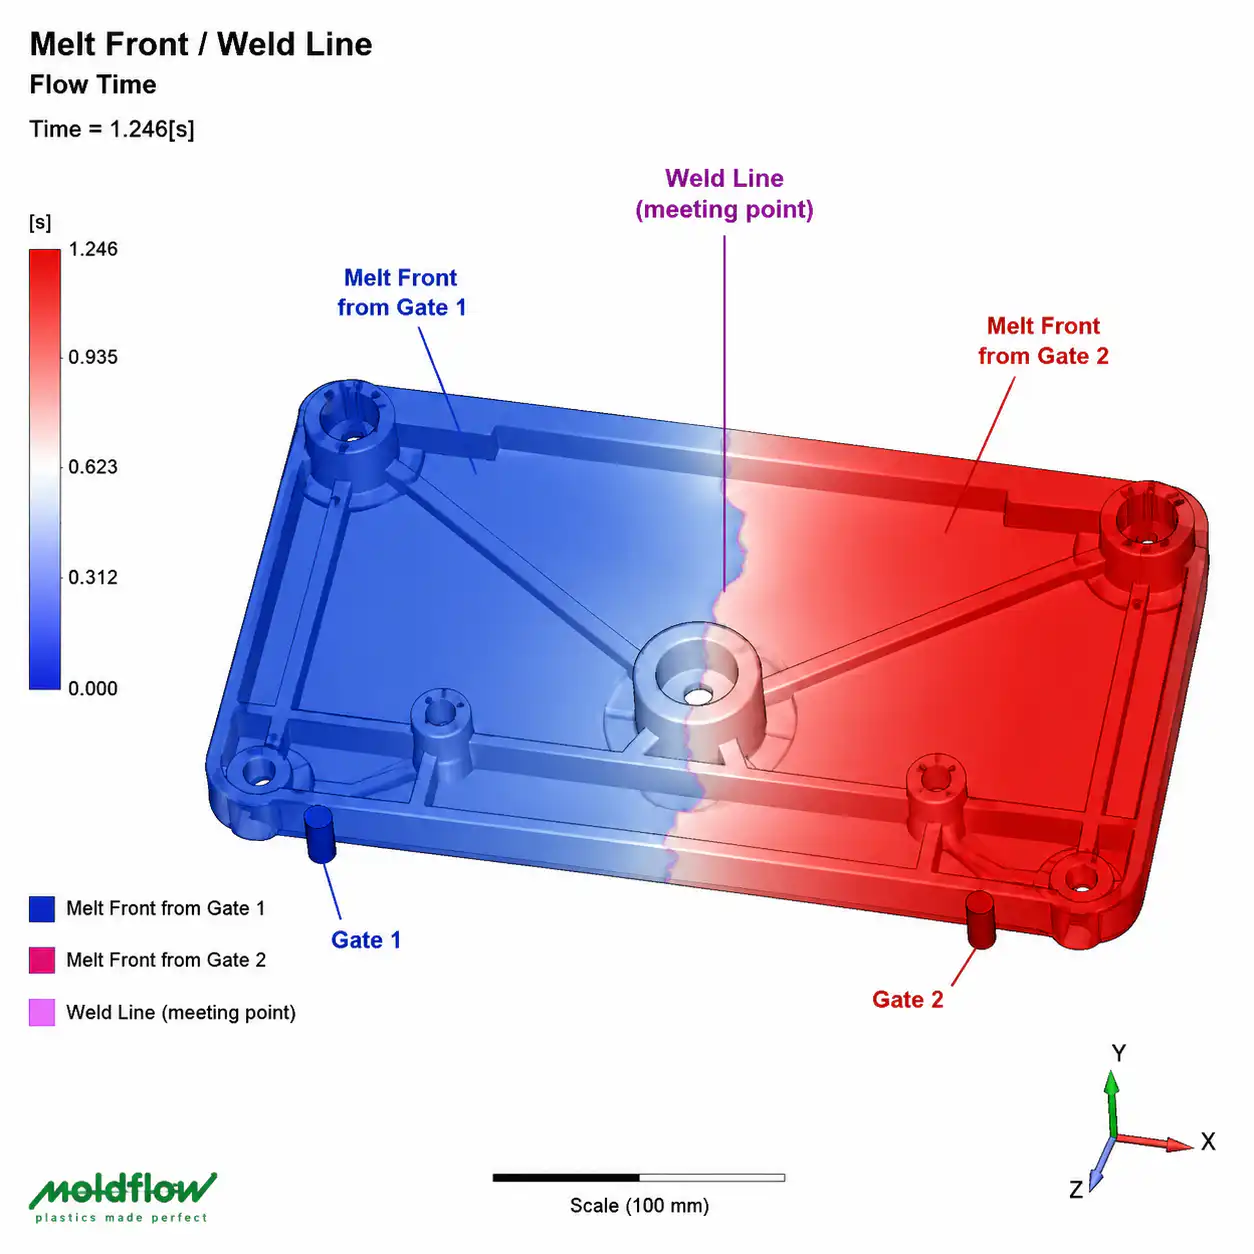
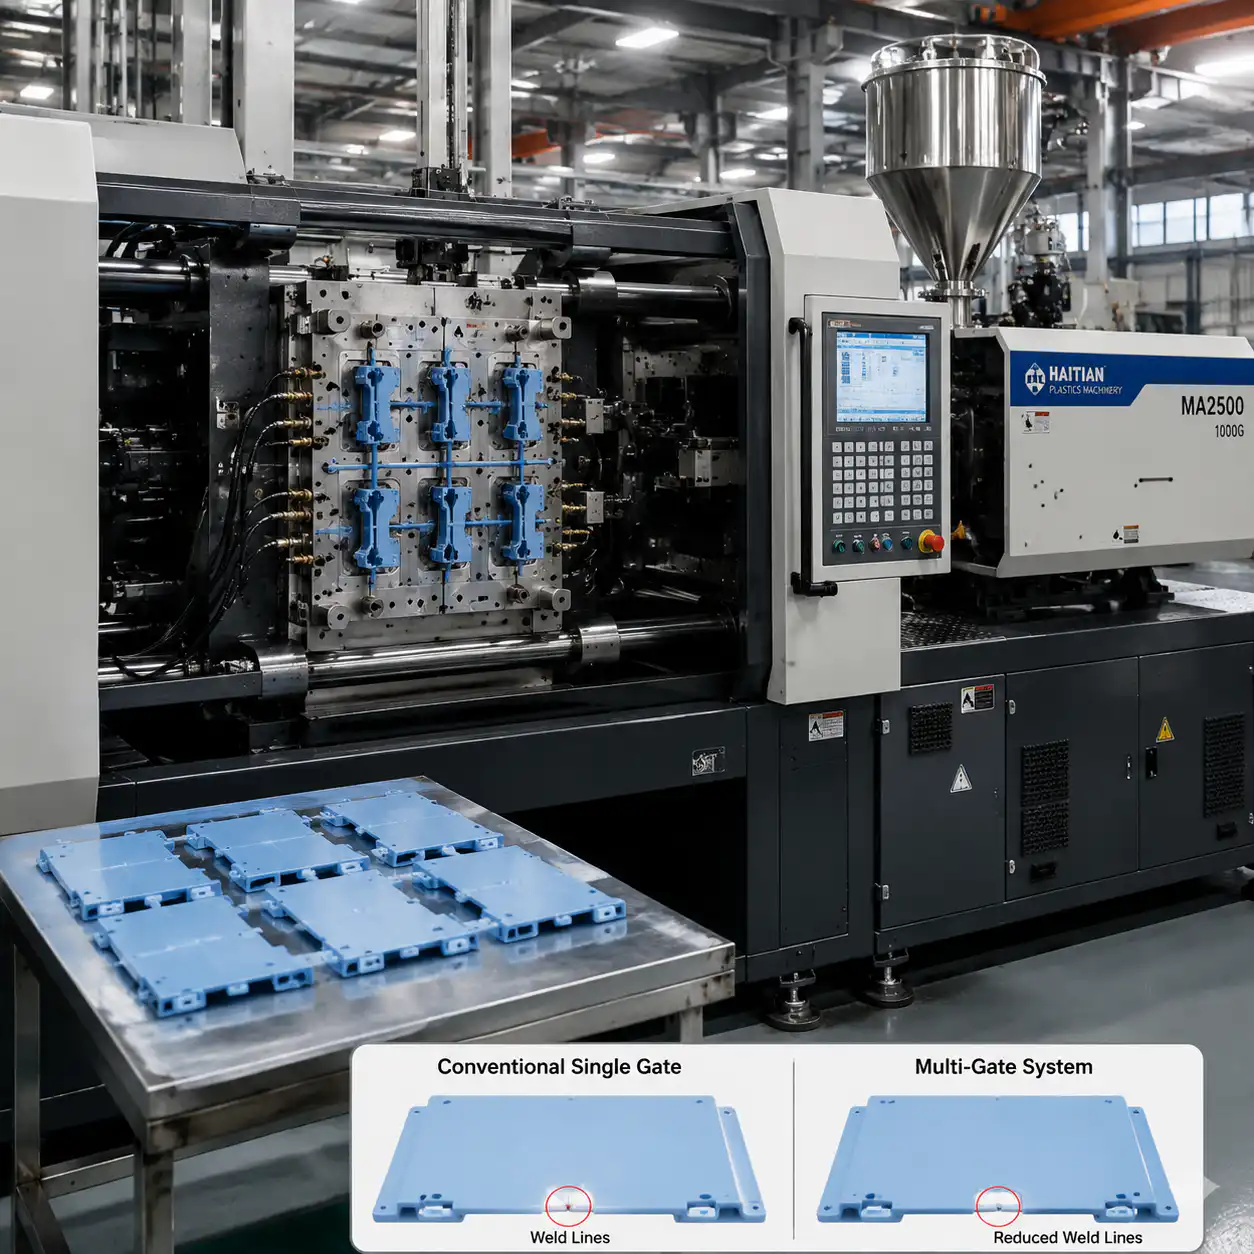
2つ以上のゲートから同時にキャビティに充填が行われると、各ゲートからの流れの先端は最終的に合流します。この合流点の位置と角度によって、ウェルドラインが決まります。大型部品を充填する際、ゲート数が多いとウェルドラインの発生がほぼ確実となるため、 ゲート配置の最適化 重要な設計上の決定。.
3. 壁厚のばらつき
肉厚の急激な変化は、流速の不均一を引き起こします。肉厚の大きい部分ではポリマーの流れが速くなり(抵抗が小さくなる)、肉厚の薄い部分の流れを追い越して、両者の流れが再び合流する箇所にウェルドラインが形成されます。このメカニズムは、部品の設計段階で見過ごされがちであるため、特に厄介です。.
溶接線の種類:コールドライン、ホットライン、マージライン
すべての溶接線が一様というわけではありません。その違いを理解することは、適切なリスク評価とリスク軽減策を立てる上で不可欠です:
| タイプ | 成形温度 | 外観 | 筋力の維持 |
|---|---|---|---|
| 冷間溶接線 | 融点以下 | 表面にシャープなV字型の溝がある | 50-70%の損失(最悪の場合) |
| ホット溶接ライン | 融点以上 | かすかな線。見えない場合もある | 10-30%の損失 |
| マージライン | 融点付近、135度を超える会合角 | しばしば目に見えない | 5-15%の損失(最良ケース) |
冷間溶接線 これは、流れの波面が合流する前に著しく冷却された場合に生じる現象であり、充填の終盤、肉厚の薄い部分、あるいは流路が長い場合に多く見られる。ポリマーの表層はすでに固化しており、結合する部分は薄い溶融コアのみとなる。その結果、表面に鋭いノッチが生じ、強度が著しく低下する。.
溶接ラインの熱変形 これは、前線がまだ完全に溶融した状態で衝突する際に生じる現象であり、通常、充填工程の初期段階で発生する。分子拡散や鎖の絡み合いは改善されるものの、前進する前線の鎖は配向しており、流れに垂直方向の可動性が制限されているため、その程度はバルク材料のレベルには依然として大きく及ばない。.
行を結合する これは、溶融点付近またはそれ以上の温度で、溶融前線が大きな角度(約135度以上)で接合する特殊なサブクラスである。接合角度が鋭角であるため、混合が促進され、絡み合い密度が高まり、一般的な溶接線に比べて著しく優れた機械的特性を発揮する。.
材料の特性:プラスチックごとに異なる溶接線の扱い方
溶接線の強度は、母材となるポリマーに大きく依存します。非晶質、半結晶性、および充填材は、溶接面において全く異なる挙動を示します:
| 素材 | タイプ | 溶接線の強度保持(%) | 主な行動 |
|---|---|---|---|
| PA66(充填剤なし) | 半結晶性 | 75-85% | 溶接強度が良好。水素結合が回復を助ける |
| PA66 GF30 | 半結晶性 + GF | 50-60% | 繊維が溶接線と平行に配向している — ブリッジ現象なし |
| PA6 | 半結晶性 | 70-80% | PA66と同様に、Tgがわずかに低いことが有利に働く |
| PP(充填剤なし) | 半結晶性 | 80-95% | Excellent weldability; slow crystallization aids healing |
| PP GF30 | 半結晶性 + GF | 45-55% | Glass fibers severely degrade weld strength |
| PC(未充填) | 非晶質 | 85-95% | Best unfilled weld retention; high melt strength |
| POM | 半結晶性 | 60-75% | Fast crystallization hurts; high mold temp helps |
| ABS | 非晶質 | 80-90% | Good weld retention; rubber phase helps toughness |
| PPS GF40 | 半結晶性 + GF | 35-50% | Worst-case weld strength; avoid structural welds |
The critical takeaway: glass fiber reinforcement amplifies weld line weakness. Fibers at the weld plane align parallel to the interface rather than bridging across it, so the weld region behaves essentially like the unfilled matrix — minus the fiber reinforcement the part was designed to rely on. A PA66 GF30 part may drop from 180 MPa tensile strength to 90-110 MPa at the weld line.
Weld Line Prediction Using Moldflow Simulation
Modern DFM (Design for Manufacturability) workflows make weld lines predictable before steel is cut. Autodesk Moldflow and similar simulation packages can identify all weld line locations during the filling analysis phase. If you want to see how those reports are interpreted, our mold flow analysis and DFM guide breaks down the most useful outputs.
Key Moldflow outputs to examine in your DFM report:
- Weld line result plot: Displays all weld line locations as colored lines. Pay attention to lines in high-stress regions identified by your FEA.
- Temperature at flow front result: The single most important predictor of weld line quality. If the temperature at flow front at the meeting point is above the material’s no-flow temperature, you are in hot weld line territory. Below it, expect a cold weld line.
- Meeting angle: Angles below 90 degrees produce poor entanglement. Angles above 135 degrees are merge-line territory. Most Moldflow packages display this as a numerical overlay.
- Fill time contour: Check whether both flow fronts arrive simultaneously. A time differential means one front is stagnant while the other advances, worsening the weld.
- Air trap result: Weld lines and air traps often coincide. A trapped air pocket at the weld location can create additional voids and burn marks.
A thorough DFM report should flag every weld line location, classify it by predicted severity (temperature + angle + stress location), and recommend specific mitigation for lines in structurally critical zones.
Prevention Strategies: Design-Level Solutions
Preventing weld lines at the design stage is always cheaper than compensating through processing. Here are the primary design-level strategies, ranked by effectiveness:
1. Gate Relocation
The single most powerful lever. Moving the gate changes the entire flow pattern. Relocate gates so that weld lines shift to low-stress, non-cosmetic regions of the part — or, ideally, to the very end of fill where they exit into an overflow well. Even a 5 mm gate position shift can dramatically alter weld line location and severity.
2. Wall Thickness Optimization
Eliminate abrupt thickness transitions that cause differential flow rates. Gradual transitions (3:1 ramp rule) allow flow fronts to stay better synchronized. In multi-thickness parts, consider localized thinning or thickening to steer the weld line position.
3. Flow Leaders and Deflectors
Flow leaders are local wall thickness increases that create preferential flow paths, steering the melt to arrive at the meeting point simultaneously and at higher temperature. This is a targeted, low-cost mold modification compared to gate relocation.
4. Overflow Wells
Position overflow tabs or wells at the weld line location. The weld line forms inside the overflow, which is then trimmed off post-molding. This is the nuclear option — it eliminates the weld line from the functional part entirely — but adds material waste and a secondary trimming operation.
5. Sequential Valve Gating
For multi-gate molds, sequential valve gating opens gates in a programmed sequence rather than simultaneously. This creates a single continuous flow front that sweeps across the cavity, eliminating multi-gate weld lines. The cost is higher tooling complexity and controller hardware, but for large structural parts (automotive bumper beams, instrument panel carriers), it is the standard approach.
Processing Fixes: Optimizing Weld Line Strength Through Parameters
When mold modifications are not feasible (existing tooling, budget constraints, or tight timelines), processing adjustments can improve weld line strength by 10-30%:
| パラメータ | Direction | Effect on Weld Line | 制限事項 |
|---|---|---|---|
| 溶融温度 | Increase 10-20 degrees C | Higher temp = better molecular diffusion at meeting plane. Strongest single processing lever. | Material degradation risk, longer cycle time, flash |
| 金型温度 | Increase 10-30 degrees C | Slows skin freezing; more time for chain entanglement before solidification | Longer cycle time, dimensional stability concerns |
| 射出速度 | Increase (faster fill) | Reduces cooling during filling; fronts meet hotter. Also increases shear heating. | Jetting, burn marks, gas traps, flash |
| 加圧状態の維持 | Increase + extend time | Compresses the weld zone; reduces voids and improves density | Flash, overpacking, molded-in stress |
| 背圧 | Moderate increase | Better melt homogeneity; consistent viscosity aids predictable flow front behavior | Excessive shear heating, fiber breakage in GF materials |
Practical processing sequence for weld line optimization: Start by raising melt and mold temperature to the upper end of the material supplier’s recommended range. Then increase injection speed incrementally while watching for flash and burn marks. Finally, dial in holding pressure and time using short-shot studies to confirm the weld line zone is fully packed. This sequence typically recovers 15-25% of the lost weld strength — not a replacement for good design, but often the difference between passing and failing a structural test.
Testing Weld Line Strength
Verifying weld line performance requires targeted testing. Standard material datasheet values assume no weld lines, so they are dangerously misleading for parts with significant weld zones:
Tensile Testing (ISO 527 / ASTM D638)
Mold tensile bars with the weld line at the gauge center (use a film gate at both ends). Compare weld-line specimen strength to unwelded control specimens from the same mold. The ratio gives you actual weld line strength retention for your material, mold, and process combination. This should be standard procedure for any structural part with weld lines.
Impact Testing (ISO 179 / ASTM D256)
Weld lines are especially damaging to impact strength — often showing 70-90% reduction even in materials with good tensile weld retention. Charpy or Izod specimens notched at the weld line location provide critical safety validation for parts subject to shock loading.
Visual Inspection Standards
For cosmetic surfaces, establish clear accept/reject criteria. Dimensional standards like DIN 16742 provide classification systems for weld line visibility. Generally: Class A surfaces (visible in use) should show no visible weld line groove under specified lighting; Class B surfaces (visible but non-cosmetic) allow a faint line; Class C surfaces (hidden) have no cosmetic restriction but still require mechanical validation. Surface texture and gloss targets also matter here, which we cover in the surface finishing guide.
For detailed PA66 GF30 properties and grade selection, see our glass-filled nylon grade comparison guide covering GF15, GF30, and GF60 stiffness, heat, warpage, and molding data.
よくある質問
溶接線は常に問題となるものなのでしょうか、それとも場合によっては許容されることもあるのでしょうか?
Weld lines are not universally catastrophic. In non-structural, non-cosmetic regions of a part they are often acceptable without modification. The key question is: Is the stress at the weld line location below the reduced strength of the weld zone? In a PC enclosure with a hole for a cable pass-through in a low-stress area, a weld line is likely fine. In a PA66 GF30 engine mount bracket with the weld line at the bolt hole — where vibration and tensile loads concentrate — it is almost certainly a failure risk. Always apply the location-based risk assessment: stress level at weld line multiplied by weld strength retention equals actual safety factor. If that safety factor is below your design requirement, the weld line is unacceptable.
PA66 GF30において、溶接線部の強度はどの程度低下するのでしょうか?
In PA66 with 30% glass fiber, tensile strength at the weld line typically drops to 50-60% of the unwelded material strength. For a typical PA66 GF30 with 170-190 MPa tensile strength, the weld line zone strength is approximately 85-115 MPa. Impact strength reduction is even more severe — often down to 20-30% of the unwelded value — because glass fibers at the weld plane provide essentially zero bridging across the interface. The polymer matrix alone must carry the load. This is why GF materials demand the most aggressive weld line mitigation strategy, and why weld line location must be a primary consideration during gate placement design for any glass-filled material.
溶接線を完全に除去することは可能でしょうか?
In parts with holes, inserts, or multiple gates, weld lines cannot be completely eliminated in a physical sense — you are always splitting and recombining flow. However, you can effectively eliminate their mechanical impact through: (1) Overflow wells that shunt the weld line into a disposable tab, physically removing it from the functional part. (2) Sequential valve gating that creates a single uninterrupted flow front for multi-gate parts. (3) Design changes that shift the weld line to a non-structural zone where strength reduction is irrelevant. The phrase “weld-line-free part” in DFM reports usually means “no weld line in any functionally critical location,” not literal absence.
Moldflowは、溶接線の位置をどの程度正確に予測できるのでしょうか?
Moldflow weld line location prediction is highly reliable — typically within 1-3 mm of the actual position on the molded part when the mesh is properly refined and process settings match production. The location accuracy comes from the solver’s ability to track flow front advancement, which is fundamentally correct physics. Strength prediction is less reliable and should be treated as a comparative ranking tool, not an absolute predictor. Moldflow’s weld line strength outputs are based on empirical correlations with meeting angle and temperature at the flow front and should be validated with physical tensile bar testing for safety-critical applications. For DFM purposes: trust the location, verify the strength prediction with real molded specimens.